In this post
What is cumulative frequency?
Frequency and cumulative frequency are very closely related. If we are given an ordinary frequency then it is easy to make this into cumulative frequency which is done by forming a ‘running total’.
So, for each new category the cumulative frequency is the normal frequency plus all of the previous ones!
Example
Below is a frequency table of scores that students got on a test marked out of 5. Find a new table which displays the cumulative frequency.
| Mark | Frequency |
|---|---|
| 1 | 2 |
| 2 | 5 |
| 3 | 11 |
| 4 | 10 |
| 5 | 3 |
To find the cumulative frequency we must add the frequency for each mark and the frequency for all marks that are lower. This is the same as adding the new frequency for a mark to the previous cumulative frequency giving:
| Mark | Frequency | Cumulative Frequency |
|---|---|---|
| 1 | 2 | 2 |
| 2 | 5 | 2+5=7 |
| 3 | 11 | 7+11=18 |
| 4 | 10 | 18+10=28 |
| 5 | 3 | 28+3=31 |
It helps to think of the cumulative frequency of each as being the frequency of people achieving the score or anything less. So, for example, the cumulative frequency of 4 is ‘how many people scored 4 or less points’.
This same method is always used when finding a cumulative frequency table: as we go down, the cumulative frequency will increase unless new frequencies are equal to 0. The cumulative frequency can never decrease from one step to another.
Cumulative frequency curves
Graphing cumulative frequencies gives a curve that can be very useful. To plot a cumulative frequency graph we must do the following:
1) Create a cumulative frequency table as usual.
2) Use the cumulative frequency as one point and the corresponding group as the other.
3) Plot the cumulative frequency on the vertical axis so that the curve climbs upwards.
The second stage is the hardest here as we must think very carefully about the x-coordinates that we will plot. The example we saw earlier would be easy as the test marks were in number form, but this is not always the case and the groups that we are finding the cumulative frequency of may be shown in words or groups of numbers.
Example
This grouped frequency table represents the exam marks of 60 students:
| Mark | Frequency |
|---|---|
| 0 – 20 | 9 |
| 21 – 30 | 14 |
| 31 – 35 | 19 |
| 36 – 40 | 11 |
| 41 – 50 | 5 |
To convert this table into cumulative frequency we use the exact same method as before to create a ‘running total’ of the frequencies. Obviously, the final value for the cumulative frequency will then also give us the total number of students that took the test.
The final amount on a cumulative frequency table is always the total of the frequencies that have been calculated, so when we get to the bottom we have added them all up! The cumulative frequency table for this example will be:
| Mark | Frequency | Cumulative Frequency |
|---|---|---|
| 0 – 20 | 9 | 9 |
| 21 – 30 | 14 | 23 |
| 31 – 35 | 19 | 42 |
| 36 – 40 | 11 | 53 |
| 41 – 50 | 7 | 60 |
This table has been calculated in this way so that, for each cumulative frequency, we have the number of students that gained a score in the mark group or anything lower. So the cumulative frequency for the group 36 – 40 is 53, meaning that 53 of the 60 students got a mark that was below 40.
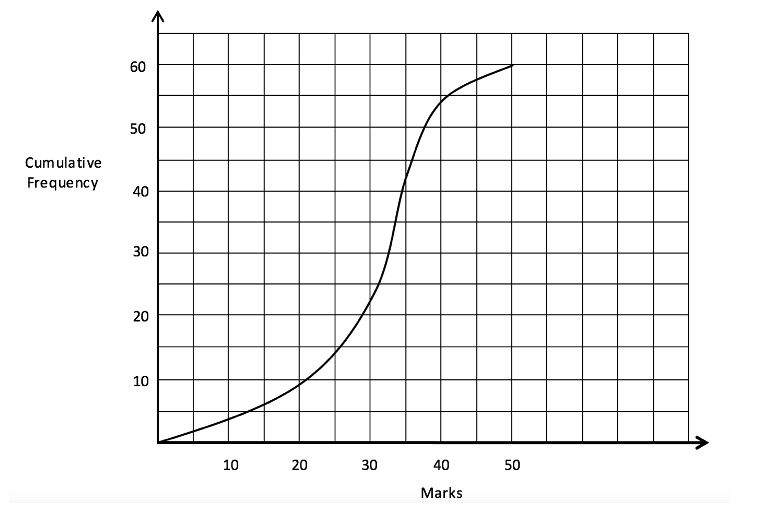
As you may have noticed, the groups for the marks in this case are not all equal. So you may be wondering what we are to do when it comes to plotting these values on a graph. The way in which we do this is to only plot the highest mark in the group. So for the group 21 – 30, we would plot 30, for the group 31 – 35 we plot 35 and so on. This is because the cumulative frequency is a ‘up to and including…’ values and the marks that are counted in a group could lie anywhere ‘up to and including’ the highest in the group.
As we have already said, the group is plotted on the horizontal axis with the cumulative frequency to be plotted on the vertical. So the points which we must plot are:
(20,9), (30,23), (35,42), (40,53), (50,60)
Where the x values are the maximum value for each group and the y values are the corresponding cumulative values. We must then plot these values on a graph and join them up with a smooth curve such as:

The cumulative frequency diagram clearly must form a smooth continuous curve that will never decrease in the vertical direction (since a ‘running total’ only ever has values added to it and not taken away).
As well as this, if you look at the different values where we have a maximum in a group (such as 21 – 30) the maximum for the group (30) coincides with the cumulative frequency at this point, which is 23.


