Customise Consent Preferences

We use cookies to help you navigate efficiently and perform certain functions. You will find detailed information about all cookies under each consent category below.

The cookies that are categorised as "Necessary" are stored on your browser as they are essential for enabling the basic functionalities of the site. ... 

Always Active

Necessary cookies are required to enable the basic features of this site, such as providing secure log-in or adjusting your consent preferences. These cookies do not store any personally identifiable data.

Functional cookies help perform certain functionalities like sharing the content of the website on social media platforms, collecting feedback, and other third-party features.

Analytical cookies are used to understand how visitors interact with the website. These cookies help provide information on metrics such as the number of visitors, bounce rate, traffic source, etc.

Advertisement cookies are used to provide visitors with customised advertisements based on the pages you visited previously and to analyse the effectiveness of the ad campaigns.

Other cookies are those that are being identified and have not been classified into any category as yet.

Line graphs

Line Graphs

All about line graphs

A line graph is a type of graph used mainly to show a difference of something over time. This is because a line runs all the way through the graph and can be followed and seen to ‘travel’ from start to finish as time goes by.

Example

Below is a graph which shows a difference in revenue at a company from 2007 to 2012. Plot this data on a line graph.

YearRevenue (£m)
20071.2
20081.1
20090.8
20101.1
20111.9
20121.7

To plot this data we must do the same method as with a frequency diagram but instead place a dot for each correct year at the right revenue amount. These dots are then joined up with straight lines.
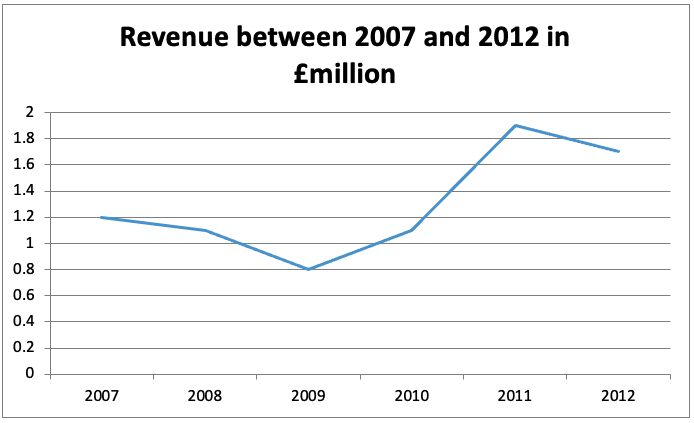
Line graph example
online gcse courses

Looking to get a GCSE?

We offer a wide range of GCSE courses.

Learn more