In this post
Velocity-time graphs will give us a value for velocity in relation to time directly, but can easily be used to find things like the acceleration of an object and the distance travelled.
As we stated early in the lesson, there is a difference between speed and velocity: velocity will use a direction and a speed, whereas stating a speed does not tell us which way we are travelling.
Speed: I am travelling at 90mph
Velocity: I am travelling at 90mph in a north direction
Hopefully, you will be able to notice that this slight difference will mean that, unlike a speed graph, velocity-time graphs can have a negative gradient if there is a change in direction.

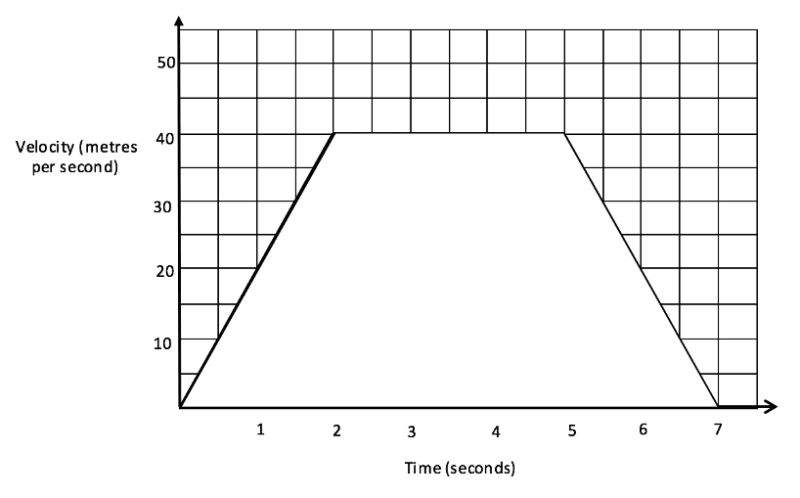
The graph above shows that we have an increasing velocity for the first 2 seconds and then this stays the same. Then the line starts to go down with a negative gradient. This does not mean that we are moving backwards as we are still travelling in the same direction, just at a decreasing velocity/speed. This graph would be the equivalent of getting in a car and speeding up to a constant speed of 40 metres per second for 3 seconds and then applying the brakes so that we slow down before coming to an eventual stop after 7 seconds.
We can then find the acceleration of certain parts of this graph by finding the gradient. So when the line is flat we have a 0 acceleration (as we are at a constant speed), when it has a positive gradient we are accelerating as the velocity is increasing and when it is negative we have a deceleration as the velocity is decreasing.
Relation to distance
There is a very easy way to find the distance travelled from a velocity-time graph: we simply find the area under the line! When doing this we should have a simple shape that can then be examined and an area found which should be left in the units that are found in the question. This is shown for the previous example:

The shaded area shows the area under the graph and can be found by splitting up into a rectangle and two triangles to have an area of 200. Therefore, this graph shows a distance moved of 200 metres!
Finding the distance from a velocity-time graph really is as easy as finding the area (from the numbers presented on the axes) that is under the line. This can obviously then be split up into sections so we could find the distance travelled up to 4 seconds for example, or the distance travelled between the 3rd and 6th second. All that we have to do is to find the area under the line between these two points on the x axis.
Summary of velocity-time graphs
| How to find… | Calculation |
|---|---|
| Velocity | On the y axis |
| Acceleration | Find the gradient of the line at a certain point (if negative then we have deceleration which is sometimes known as retardation) |
| Distance travelled | Area under the line |
Deceleration
Deceleration is found on a velocity-time graph when the line has a negative gradient. As already explained, this does not mean that the object is travelling in a different direction to what it would be if the line were positive. We are still travelling in the same direction, we are just slowing down. This can be thought of as applying the brakes in a car which causes your velocity to decrease.
Acceleration units
An acceleration or deceleration is written with units ![]() of which is said as ‘metres per second per second’. The units that are used can be very confusing so we should just remember the following:
of which is said as ‘metres per second per second’. The units that are used can be very confusing so we should just remember the following:
| Calculation | Units (with metres) |
|---|---|
| Distance | |
| Speed | |
| Acceleration |
Example
Find the following from the graph below:
1) The acceleration at 2 seconds
2) The acceleration at 6 seconds
3) The total distance travelled
4) The distance travelled between 3 and 6 seconds

1) At 2 seconds the gradient of the line is such that for every second that passes, the velocity increases by 5 metres per second. Therefore, the acceleration must be ![]() .
.
2) At 6 seconds we are decelerating at a rate of ![]() therefore the acceleration is
therefore the acceleration is ![]()
3) To find the total distance travelled we need to get the area underneath the line. Doing this we find a distance of ![]() .
.

The above graph is easily broken up into sections that are either rectangular or triangles so that each area can be found and then the total added up to give the entire area under the graph. This is then obviously equal to the distance travelled and is 110m, as explained on the previous page.
| Region Colour | Shape | Calculation | Area |
|---|---|---|---|
| Purple | Triangle | 22.5 | |
| Yellow | Rectangle | 15 | |
| Red | Triangle | 12.5 | |
| Blue | Triangle | 60 | |
| Total | 110 |
4) Finally, we need to get the area under the graph but only between 3 and 6 seconds. This is fairly easy to do, and again the area is split down into manageable sections and then added together.

This gives us an area between 3 and 6 seconds of 80.835m.
This would actually be easier to calculate using the entire area under the graph minus the smaller areas that are not needed. So this can obviously be done if needed as long as the correct area is calculated.


