In this post
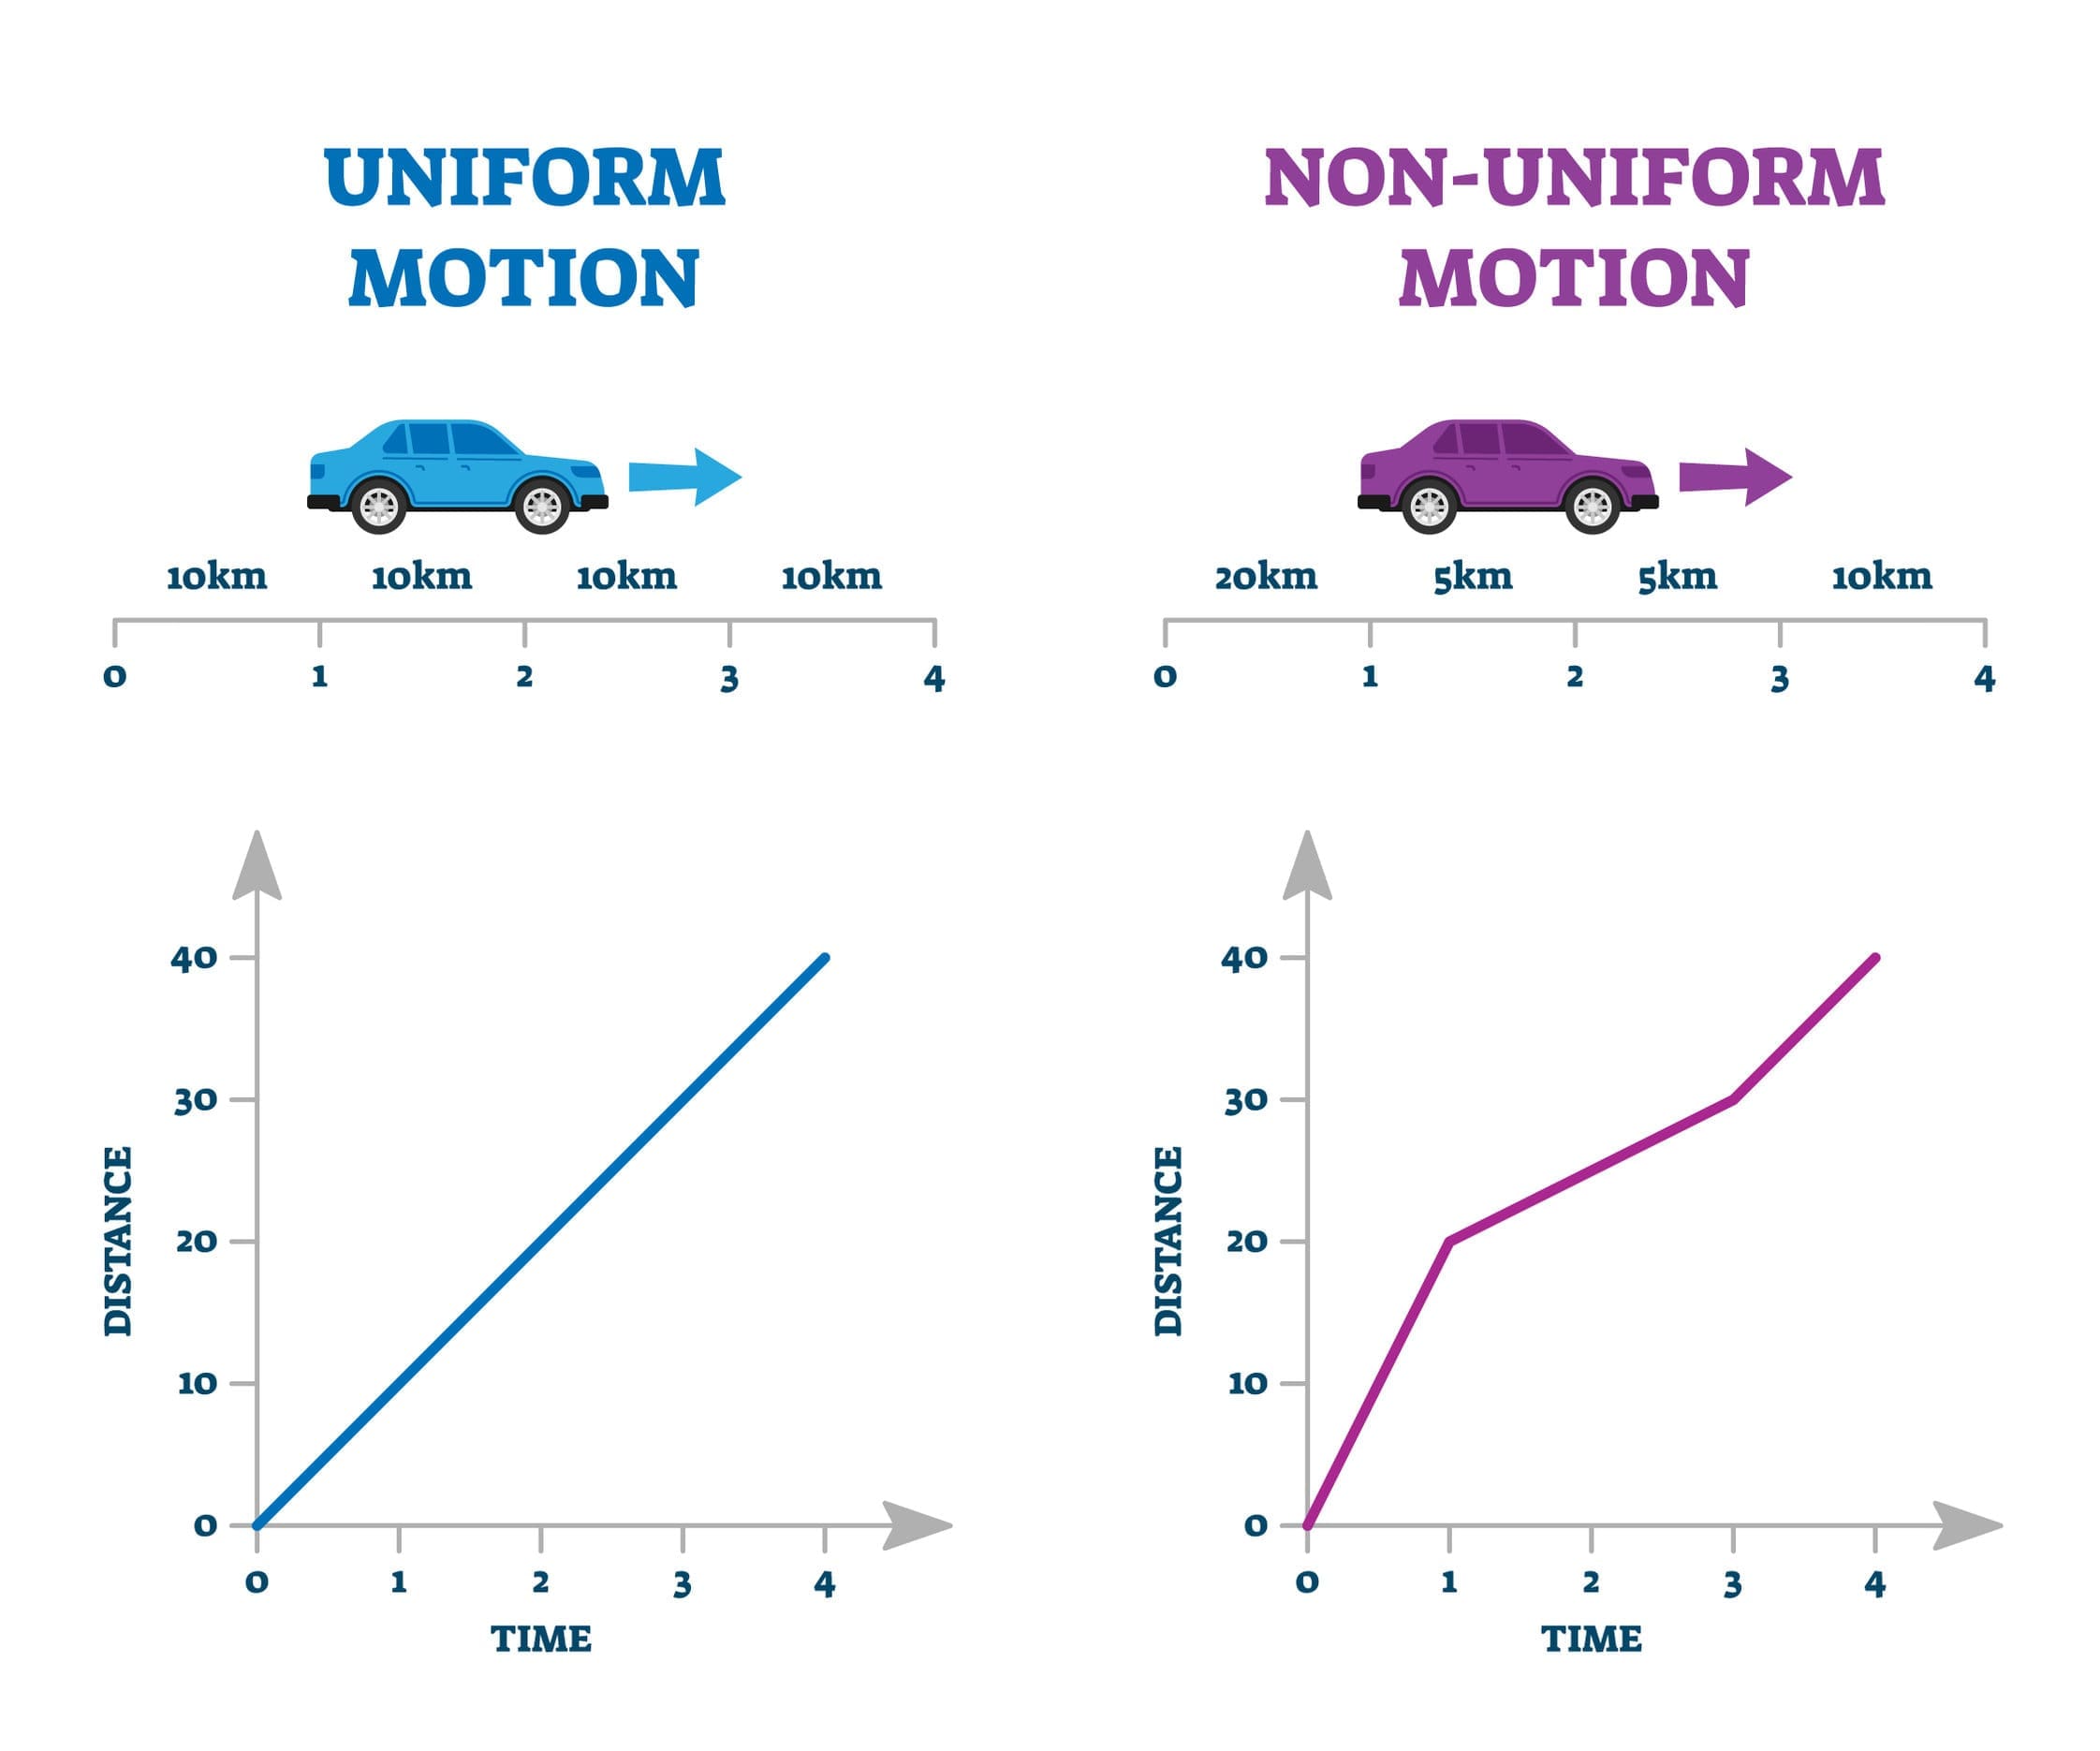
We have looked at the relationship between speed, distance and time, so now we can expand on these ideas using graphs. These graphs are called distance-time graphs and plot the distance that an object has travelled against time. The time is plotted on the axis, and the distance the object has travelled is plotted along the axis. The information shown on distance-time graphs allows us to calculate the speed at which the object is travelling.
For the exam you must be able to:
- Interpret a distance-time graph and explain what it shows
- Plot a distance-time graph from given information
There are only two techniques that are needed for both of these:
- Plotting the coordinates of points on a graph
- Using speed=distance/time or one of its variations
Example
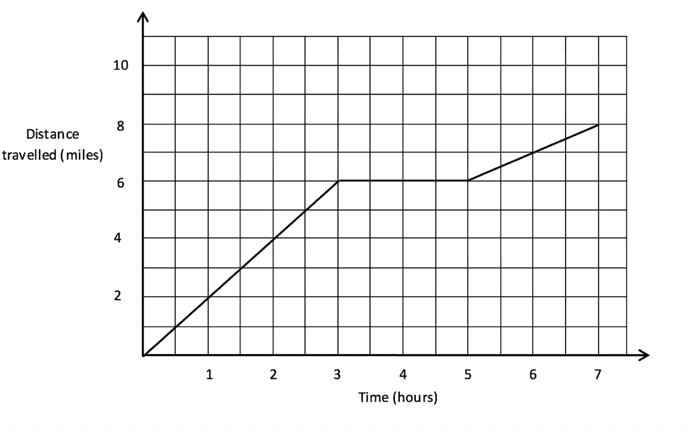
The graph below shows a journey made by three walkers climbing a mountain. The graph shows the time taken in hours and distance travelled in miles. The shape of the graph can be used to deduce when the walkers were on the move and when they stopped for lunch. Answer the questions below.

Work out the number of hours the walkers travelled for before they stopped for lunch.
Work out how many hours they stopped for lunch.
Calculate the walkers’ average speed after lunch.
How different is the average speed after lunch from their average speed before lunch?
The first part of the journey is for 3 hours before they stopped, as seen on the horizontal axis.
They then stopped between 3 hours and the 5th hour, therefore they stopped for lunch for a total of 2 hours.
The last part of the journey was for two hours and they travelled 2 miles (read from the two axes), so the average speed was (2 miles)/(2 hours)=1 mile per hour.
Before their lunch the walkers travelled 6 miles in a time of 3 hours which means that they had an average speed of (6 miles)/(3 hours)=2 miles per hour. This therefore tells us that the speed after lunch was 1 mph less than the speed before.
Displacement
Not all graphs are the same as in our previous example. Some may be slightly different and plot something called displacement. Rather than being a simple distance, displacement is a measure of how far something is from a start point. The typical examples seen with these types of graph include journeys where someone is travelling from and back to the same point. This means that parts of the graph drawn for displacement-time graphs could have a negative gradient.
For example, a graph plotting the distance of a man away from his car may start at 0 when he is in the car, increase as the man gets out and walks into a shop away from the car but then decrease again back to 0 when he returns to the car with the items he has bought.
Example
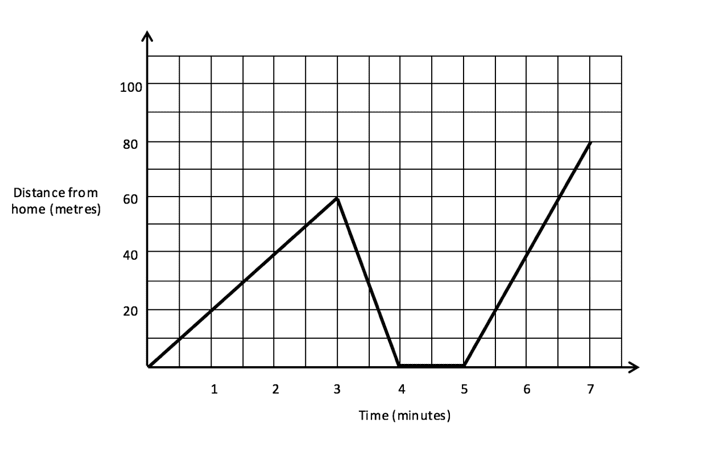
The diagram below shows a distance-time graph of a man’s journey to and from his home. It shows the current distance he is from his house and the time in minutes. Answer the questions below.

1) How long does the man stay at home for in the diagram?
2) What is his average speed from the 5th to 7th minutes?
3) What is his average speed up to the time when he returns to his home on the 4th minute?
1) The middle part of the graph shows when the man is at home (0 metres from his house) and is 1 minute long.
2) Between the 5th and 7th minute the man travels 80 metres and therefore his average speed is 40 metres per minute.
3) This question is a little trickier: the answer is not 0. Just because he ends up at the same place which he finished does not mean that his speed was 0, it just means that he travelled back to the same place. When travelling away from his house he travelled 60 metres in 3 minutes and then back to his house he again travelled 60 metres but in 1 minute. This means that he travelled a total of 120 metres in 4 minutes, so he has an average speed of 30 metres per minute.
Plotting graphs from information given
When we are given written information we can use it to draw a speed-distance graph. All that we have to do is split the information up into separate parts that have different speeds and distances and then draw the correct gradient for the line. The line must never have any breaks going from left to right (changing in time) or go back on itself. If this were to happen it would be the very strange case of time travelling! Therefore, the line must always carry on travelling towards the right.
Example
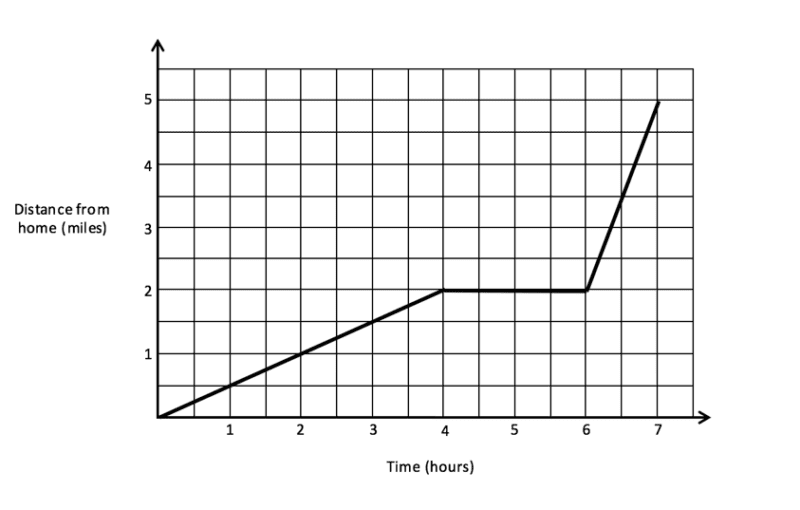
Will leaves his house and travels to his friend’s house over a distance of 2 miles in 4 hours. He stops for 2 hours at his friend’s house before travelling a further 3 miles from his house in 1 hour. Draw a graph to represent this.
By splitting Will’s journey up into its three component parts we can use this information to produce a distance-time graph. We must make sure that the line travels from left to right with varying gradients to show the speed and that each new part of the journey always continues from the previous line drawn.


