In this post
Kinematics is just a fancy name for the study of motion and the way that things move around. It is therefore related to things like speed and acceleration.
Most people think that the terms speed and velocity are interchangeable but really they do have differences. Speed is concerned only with how fast something travels and is represented as only a number. Velocity is different as it takes into account the speed and direction of something.
Keywords
Speed
How fast something is moving, e.g. 50 miles per hour.
Velocity
How fast something is moving and in what direction, e.g. 50 miles per hour to the north.
Acceleration
How quickly speed changes over time.
Another thing that we must learn is acceleration which is a relation for how quickly a speed changes.
Distance-time graphs
We have now looked at the relationship between speed, distance and time. We will now examine the same ideas but within the context of graphs. You will need to be able to:
- Interpret a distance-time graph to see what it tells us
- Draw a distance-time graph from given information
There are only two techniques that are needed for both of these:
- Plotting the coordinates of points on a graph
- Using \( speed=\frac{distance}{time} \) or one of its variations
Example
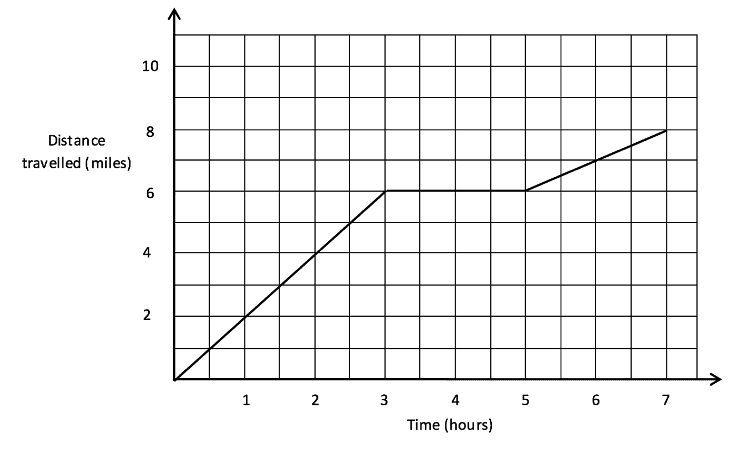
The graph below shows a journey by three walkers up a mountain detailing the time taken and distance travelled for when they were on the move and stopped for lunch. Answer the questions below.

1) How long did the walkers travel for before they stopped?
2) How long were they stopped for lunch?
3) At what average speed did they travel after their lunch?
4) How much different is this from the speed before they ate lunch?
1) The first part of the journey is for 3 hours before they stopped as seen on the horizontal axis.
2) They then stopped between after 3 hours and stayed until the 5th hour, therefore they stopped for a total of 2 hours.
3) The last part of the journey was for two hours and they travelled 2 miles (read from the two axes), so the average speed was \( \displaystyle\frac{\mbox{2 miles}}{\mbox{2 hours}} \)= 1 mile per hour
4) Before their lunch the walkers travelled 6 miles in a time of 3 hours which means that they had an average speed of \( \displaystyle\frac{\mbox{6 miles}}{\mbox{3 hours}} \)= 2 mile per hour. This therefore tells us that the speed after lunch was 1 mph less than the speed before.
Example
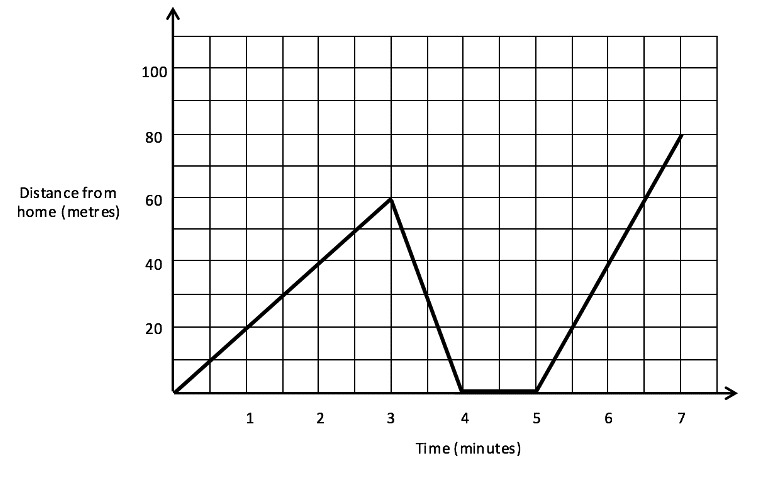
Below shows a graph of a man’s journey to and from his home. It shows the current distance he is from his house and the time in minutes. Answer the questions below.

1) How long does the man stay at home for in the diagram?
2) What is his average speed from the 5th to 7th minutes?
3) What is his average speed up to the time when he returns to his home on the 4th minute?
1) The middle part of the graph shows when the man is at home (0 metres from his house) and is 1 minute long.
2) Between the 5th and 7th minute the man travels 80 metres and therefore his average speed is 40 metres per minute.
3) This question is a little trickier: the answer is not 0. Just because he ends up at the same place which he finished does not mean that his speed was 0, it just means that he travelled back to the same place. When travelling away from his house he travelled 60 metres in 3 minutes and then back to his house he again travelled 60 metres but in 1 minute. This means that he travelled a total of 120 metres in 4 minutes, so he has an average speed of 30 metres per minute.
Plotting graphs from information given
When we are given written information we can use it to draw a speed-distance graph. All that we have to do is split the information up into separate parts that have different speeds and distances and then draw the correct gradient for the line. The line must never have any breaks going from left to right (changing in time) or go back on itself. If this were to happen it would be the very strange case of time travel! So the line must always carry on travelling towards the right.
Example
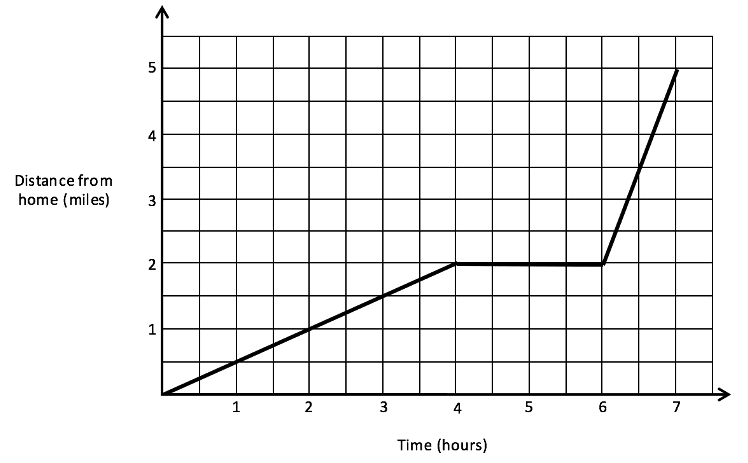
Will travels from his house a distance of 2 miles in 4 hours. He then stops for 2 hours at his friend’s house before travelling a further 3 miles from his house in 1 hour. Draw a graph to represent this.
By splitting the problem down into three parts we can easily plot this situation and make sure that the line travels from left to right with varying gradients to show the speed. Each new part to the journey follows on from the previous line drawn.


